Hyundai's Georgia EV Plant — Capital Decisions in a Dynamic Market
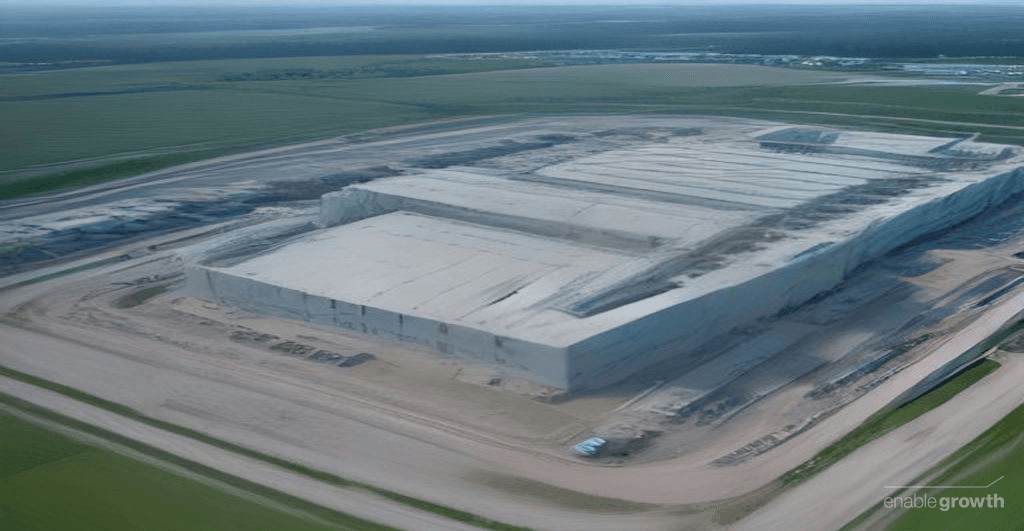

In a recent period, Hyundai Motor Group broke ground on a major electric vehicle and battery plant in Bryan County, Georgia—a significant automotive investment in U.S. history at the time. The facility was designed to produce a substantial number of EVs annually, a scale intended to capture a significant share of the projected American market. Yet the variables beneath that capacity—EV adoption, battery economics, IRA eligibility and labor productivity—have shifted since the investment was approved. The strategic question is whether Hyundai’s capital commitment still matches current market conditions or whether its economics now depend on initial planning inputs.
The Major Investment — Sizing the Initial Projections
Hyundai’s Georgia decision had a coherent industrial logic. Local production could reduce shipping costs, shorten delivery times, qualify more vehicles for U.S. incentives and give the group a platform for several brands. The site also created proximity to the Port of Savannah and a growing Southeast supplier network. Hyundai’s original announcement set annual vehicle capacity at a substantial level; later plans expanded the Georgia footprint and contemplated even greater capacity for electrified vehicles.
That logic also created four linked exposures.
Demand was treated as a capacity problem
A large plant works best when demand grows steadily enough to absorb fixed costs. In the initial planning phase, automakers were responding to rapid EV sales growth, tight inventories and strong policy support. But a forecast of near-term EV penetration was never a fact. It was a planning input tied to consumer affordability, charging access, interest rates, model availability and resale values.
If adoption rises more slowly than expected, the cost is not limited to unused machinery. Underused lines spread depreciation, engineering, maintenance and salaried labor across fewer vehicles. The result can be discounting, delayed shifts or a heavier reliance on hybrids while the plant carries an EV-oriented cost structure.
Subsidies were treated as durable infrastructure
The Inflation Reduction Act offered a powerful reason to manufacture batteries and vehicles in North America. But qualification depends on detailed sourcing, assembly and foreign-entity rules. Those rules have continued to evolve, with battery-content requirements and restrictions affecting the eligibility of components and critical minerals.
The strategic risk is a mismatch between physical assets and regulatory qualification. A factory can be in the right country and still produce vehicles that do not receive the full consumer benefit. That weakens pricing power precisely when a plant needs volume.
Battery parity was treated as a date
Battery economics depend on chemistry, energy density, manufacturing yield, mineral prices and scale. Lithium prices have been highly volatile, experiencing significant fluctuations from their peak in a recent period, leaving producers and automakers with different economic outcomes.
Lower commodity prices can help vehicle costs, but volatility complicates long-term contracts and upstream investment. The central issue for Hyundai is therefore less whether batteries become cheaper in a particular year than whether the plant can remain profitable across several cost paths.
Productivity was treated as a launch target
A high annual production figure describes potential throughput, not guaranteed output. It requires trained workers, stable suppliers, high equipment availability and a successful launch curve. A recent labor agreement raised compensation across unionized U.S. auto manufacturing, increasing the labor-cost hurdle for any manufacturer building a large American workforce.
Hyundai’s response has included automation, supplier localization and a production system designed around multiple electrified models. Those measures may improve economics, but they also increase coordination demands during the ramp.
The Unrecognized Erosion Risk — What Changed Since Initial Planning?
The most serious problem is not that every initial forecast was wrong. It is that several inputs can change independently, while the capital base remains fixed.
| Initial planning input | Signals visible currently | Strategic exposure |
|---|---|---|
| Rapid U.S. EV adoption would support a planned capacity ramp | Consumer demand became more sensitive to price, financing and charging availability; adoption growth was uneven across segments | Underutilized capacity and pressure to discount |
| IRA support would translate smoothly into vehicle economics | Battery sourcing and foreign-entity rules added qualification complexity | Lost or delayed incentives and weaker price realization |
| Battery costs would follow a predictable decline | Lithium prices moved sharply in both directions, complicating procurement and investment planning | Unstable unit economics and contract risk |
| A high annual production target would be reachable as the site matured | The facility’s initial output potential depends on labor, suppliers, uptime and model mix | Lower returns during the ramp |
| U.S. labor economics would remain manageable | A recent labor agreement reset compensation expectations in the sector | Higher break-even volume |
This is where capital allocation becomes a timing problem. Once foundations, paint shops and battery lines are committed, management can adjust model mix and shifts, but it cannot quickly recover the opportunity cost of the original design. The group has more flexibility than a single-model plant because the site can produce multiple electrified vehicles. That flexibility matters, yet it does not eliminate the burden of fixed costs.
The Strategy Drag — Why Fixed Plans Lose Time
Annual planning can be adequate for routine capacity decisions. It becomes slow when the variables move quarterly. An annual budget cycle may identify a volume shortfall after equipment orders, supplier commitments and workforce plans have already been set.
Tesla offers a useful contrast in operating rhythm. Its public reporting and quarterly production disclosures expose a shorter feedback loop between demand, output and delivery decisions, although that cadence also produces volatility and frequent changes in expectations. The lesson is not that Hyundai should copy Tesla’s management style. It is that capacity decisions need trigger points faster than the depreciation schedule.
Toyota’s prior decision to accelerate its EV strategy illustrates the cost of strategic hesitation. Toyota announced a major expansion of battery-electric investment after years of emphasizing hybrids and fuel-cell vehicles. Its eventual commitment was substantial, but the shift required catching up in product, battery and manufacturing ecosystems while competitors had already accumulated experience.
Hyundai avoided that particular delay. It committed early and built a major domestic platform. Its risk now runs in the opposite direction: continuing to treat the original volume case as the central reference point after market conditions have changed.
Executives should separate three decisions that are often bundled together:
- Whether the plant remains strategically necessary.
- Whether the original volume ramp remains credible.
- Whether the next tranche of equipment and hiring should proceed on the same timetable.
The first can be yes while the second and third require revision.
For a broader operating framework, the Ultimate Strategic Planning Guide explains how to connect long-range choices to measurable review points. The Strategy Drag Calculator can help estimate the cost of delayed decisions across capital, labor and margin premises.
The Live Alternative — Turning Signals Into Decisions
A stronger system would attach each major capital decision to a small set of measurable triggers. EV demand could be tracked through order rates, incentives, inventory days and financing costs. Battery economics
Explore the Automotive & Connected Mobility in Full 3D
Software-Defined Vehicles (SDV), EV Battery Supply Grid & Direct Fleet Transition. Test real-time scenario adjustments and observe strategic drag shifts live without setting up an account.
Quantify Your Organization's Strategic Drag
Static annual roadmaps and decision latency cost enterprise teams an estimated 15% in lost execution velocity. Run our 60-second diagnostic to calculate your dollar drag.
Start Playing with Strategy OS
Transform your static plans into dynamic knowledge with our AI-powered strategic platform.
Start Free Trial